Aug 11, 2023
How to Compare Investments using Excel and CAGR
Philip Wiest, Guest Blogger

Financial literacy is an essential skill.
How do you compare lump sum investments?
CAGR stands for Compound Annual Growth Rate. It measures the annual rate of return for an investment over an investment period and returns a representation of the per year percentage. You can use Microsoft Excel to help calculate this important financial metric.
Above all, CAGR is not an “average.”
Let’s say you’ve invested in a mutual fund. The return on your investment has been “up and down.”
| Year 1 | 20% |
|---|---|
| Year 2 | -8% |
| Year 3 | 18% |
| Year 4 | 12% |
| Year 5 | 10% |
The CAGR is not the average of the five years (52/5) = 10.4%
The return on your investment is just a variation on the Future Value (FV) calculation.
FV = PV(1+r)n
FV is Future Value, PV is Present Value, r is the rate of return and n is the number of periods.
If you solve the formula for “r” (the rate of return), you’ll see the gradual transformation from a Future Value formula to the CAGR formula.
The Transformation to the CAGR Formula

- FV = PV(1+r)n
- FV/PV = (1+r)n
- (FV/PV)1/n = 1+r
- (FV/PV)1/n -1 = r
- (FV/PV)1/n -1 = CAGR
Compound Annual Growth Rate is a basis by which we can compare returns for different investments and give a true calculation of the “per period” rate of return.
The CAGR is an estimate of the rate of return per year. The CAGR is the imaginary rate of growth that, if compounded annually, is equivalent to what your investment achieved over a period of time.
It’s important to understand that a variable investment doesn’t actually grow this amount every year; some years it’s higher, and some years it’s lower. However, it provides a useful way to compare different investments.
The CAGR is called a “smoothed” rate of return because it measures the growth of an investment as if it had grown at a steady rate on an annually compounded basis.
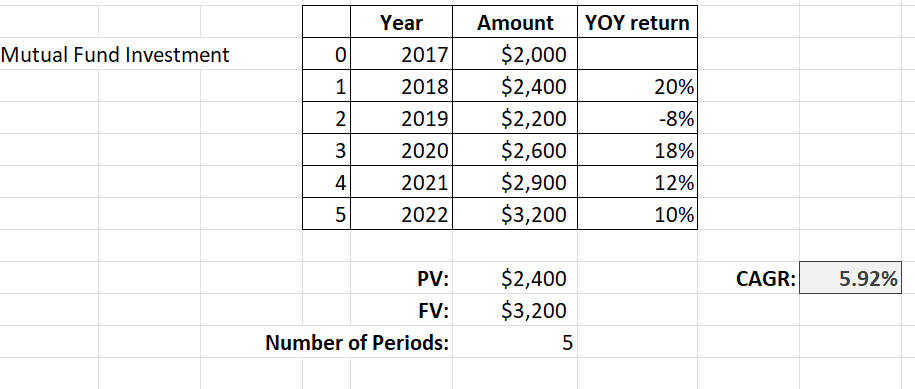
In the above example, you would describe the CAGR (shaded) as 5.92% (even though the average of the yearly returns is 52/5 (10.4%) As with all investments, past performance is no guarantee for future results.
The Top 5 Reasons to Understand CAGR
CAGR is an important financial metric that provides a standardized way to measure and compare the growth rates of investments, businesses, or economic indicators over a specific period of time.
CAGR smooths out volatility.
It smooths out the impact of short-term fluctuations and provides a more accurate representation of average annual growth.
CAGR enables meaningful comparisons.
Different investments or business ventures that have different timeframes or periods under consideration can be compared. By calculating the CAGR, you can directly compare the growth rates of investments with different starting and ending points, allowing for better decision-making.
CAGR provides a compound growth perspective.
It reflects the rate at which an investment or business has grown on an annualized basis, considering the reinvestment of returns or profits. This is particularly relevant when evaluating long-term investments or business performance.
CAGR is useful for forecasting and goal setting.
By understanding the average annual growth rate achieved in the past, you can project the expected growth rate into the future and set realistic goals and expectations. It helps in financial planning, investment analysis, and strategic decision-making.
CAGR standardizes growth measurement.
It allows investors, analysts, and researchers to evaluate performance consistently and objectively, facilitating meaningful discussions and comparisons in the financial domain.
Where Would I Use CAGR?
CAGR is useful in various situations where you need to analyze or compare the growth rates of investments, businesses, or economic indicators. Here are some specific situations where CAGR is commonly used:
Investment analysis:
When evaluating investment opportunities, CAGR helps investors understand the historical growth rate of an investment. It allows them to compare different investments and assess their potential returns over time, which allows them to make informed decisions based on the expected growth rates.
Business performance evaluation:
CAGR helps business owners, managers, and analysts analyze the historical performance of a company and project future growth rates. CAGR can be used to evaluate revenue growth, profitability, customer base expansion, or any other relevant business metrics.
Financial planning:
CAGR is valuable in financial planning to set realistic goals and projections. It enables individuals or businesses to estimate future growth rates based on historical data. For example, when planning for retirement or setting financial targets, CAGR can help determine the required growth rate or investment returns to achieve the desired financial outcome.
Market analysis:
CAGR is commonly used in market research to evaluate the growth rates of specific industries or sectors. It helps analysts understand the overall market trends and identify areas of potential growth or decline. CAGR can be used to compare the growth rates of different markets or benchmark against the overall economic growth rate.
Performance benchmarking:
CAGR allows for meaningful comparisons between different investments, companies, or industries. It serves as a benchmark to evaluate performance against a standardized growth metric. For example, a company can compare its revenue growth with the industry's CAGR to assess its relative performance.
Investment reporting:
CAGR is often used in investment reports and presentations to communicate growth rates in a standardized and easily understandable format. It provides a concise summary of the investment's historical performance and helps stakeholders comprehend the growth trajectory.
Speaking of investments, look to CAGR for guidance if you’re considering making one.
Four Industries with Strong CAGR Use Potential
CAGR is applicable in various scenarios when analyzing growth rates, making investment decisions, evaluating business performance, or setting financial targets are important considerations. It provides a consistent and meaningful way to measure and compare growth over time.
- Technology – This includes software development, cloud computing, and digital services, which have been known for its high growth rates. Companies in areas such as artificial intelligence, cybersecurity, e-commerce, and renewable energy technology have seen significant growth in recent years.
- Healthcare and biotechnology – With advancements in medical research, pharmaceuticals, and healthcare services, the healthcare and biotechnology industries have witnessed strong growth. Developments in personalized medicine, genomics, and biopharmaceuticals have contributed to their expansion.
- Renewable energy – Increasing awareness of climate change and a shift towards clean energy have driven growth in the renewable energy sector. Industries such as solar power, wind energy, and energy storage have experienced rapid expansion due to technological advancements and supportive government policies.
- E-commerce and online retail – The growth of e-commerce and online retail has been substantial, driven by changing consumer preferences and increased internet connectivity. Companies that facilitate online transactions, logistics, and digital marketplaces have benefited from this trend.
On the other hand, where would you predict a lower CAGR, of late?
Three Industries with Lower CAGR Use Potential
- Traditional retail – The traditional brick-and-mortar retail industry has faced challenges due to changing consumer behavior and the rise of e-commerce. However, certain segments within retail, such as luxury goods or specialty stores, may still exhibit growth.
- Oil and gas – The oil and gas industry has experienced volatility due to fluctuating commodity prices, geopolitical factors, and increased focus on renewable energy alternatives. This has led to relatively lower growth rates compared to other industries.
- Legacy media – Traditional media industries, such as print publishing and cable television, have faced challenges with the rise of digital media and streaming services. However, some companies have adapted to digital platforms and diversified their offerings.
Where can I find CAGR figures?
You can find CAGR figures from various sources, including financial databases, market research reports, and financial statements of companies.
Here are six common sources of CAGR figures:
Financial databases:
Online financial databases such as Bloomberg, Reuters, FactSet, or Morningstar provide comprehensive financial data on companies, industries, and markets. These platforms often include CAGR calculations and historical growth rates for various financial metrics.
Company annual reports:
Publicly traded companies typically publish annual reports or 10-K filings that contain detailed financial information, including historical performance. These reports often provide CAGR figures for key financial indicators such as revenue, earnings, or shareholder returns.
Market research reports:
Market research firms and industry-specific publications often release reports that include CAGR figures for specific sectors or markets. These reports analyze industry trends, market size, and growth rates, providing insights into CAGRs for various industries or segments.
Government economic data:
Government agencies, such as the Bureau of Economic Analysis (BEA) in the United States or statistical offices in other countries, publish economic data that may include CAGR figures for GDP, employment, or industry-specific indicators.
Financial news websites:
Financial news websites like CNBC, Forbes, or Financial Times often provide market analysis, company profiles, and industry reports that may include CAGR figures or growth rate analysis.
Research reports and white papers:
Academic research papers, industry research publications, or white papers by consulting firms may contain CAGR figures for specific industries, markets, or investment sectors. These sources can provide in-depth analysis and insights into growth trends.
Keep in mind that it's important to ensure the reliability and credibility of the sources. Verify the reputation of the data provider or publication, consider using multiple sources to cross-reference information, and be mindful of the data's time relevance, as market conditions can change over time.
Additionally, some financial modeling tools or spreadsheet software allow you to calculate CAGR manually using historical data, giving you the flexibility to tailor the calculations to your specific needs.
For Practice:
The concept of CAGR is relatively straightforward and requires only three primary inputs: an investment’s beginning value, ending value, and the time period. Online tools, including CAGR calculators, will calculate CAGR when entering these three values.
Try this:
Initial Investment = -1,000
Final Value = 2,200
Time period (n) = 4
[(Final Value) / (Initial Value)] ^ (1/n) - 1
In this case, the CAGR is 21.79%.
Initial and Final Value Over 4 Periods
| Open | 1 | 2 | 3 | 4 | Close |
|---|---|---|---|---|---|
| ($1,000.00) | - | - | - | - | $2,200.00 |
Formula
(2,200/-1,000)^(1/4)-1 = 21.79% CAGR
Is 21.79% CAGR a good return?
Compared to what?
That’s the key to Compound Annual Growth Rate. Use it to compare different investments across different time periods. If the investment were across 10 time periods, your annualized return should be lower.
Initial and Final Value Over 10 Periods
| Open | 1 | 2 | 3 | 4 | 5 | 6 | 7 | 8 | 9 | 10 | Close |
|---|---|---|---|---|---|---|---|---|---|---|---|
| ($1,000.00) | - | - | - | - | - | - | - | - | - | - | $2,200.00 |
Formula
(2,200/-1,000)^(1/10)-1 = 8.20% CAGR
Happy comparing!
Ready to learn more? Check out some of SkillPath’s live virtual training programs, on-demand video training or get it all with our unlimited eLearning platform.
Philip Wiest
Guest Blogger
Philip Wiest is an expert software trainer, computer analyst and database consultant who knows both the intricacies of computer systems and the ways today’s professionals need to use these essential business tools. Using his experience in Microsoft Excel and Microsoft Office, as well as Windows and the Internet, Phil uses a special mix of tactful guidance and distilled observation so his audiences learn and retain the critical keystrokes, application combinations and creative processes that save time and simplify computer use.
Latest Articles