Dec 01, 2023
Will Excel’s New Functions, GROUPBY and PIVOTBY, Mean the End of PivotTables?
Philip Wiest, Guest Blogger
If you aren’t keeping up with GROUPBY and PIVOTBY, the latest functions in Excel, you’re falling behind — and catching up is no fun. Excel Program Manager Joe McDaid announced the release of these functions in November 2023; in short, rather than refreshing a PivotTable, you can write short, simple formulas that update immediately.
Imagine something like this:
=PIVOTBY(Dept, Salary, SUM)
or
=GROUPBY(Dept, Salary, SUM)
Microsoft Excel GROUPBY
How bad could it be when you have only three arguments — just like XLOOKUP?
Here’s the breakdown:
=GROUPBY(what are you grouping by, what values are you aggregating, what function are you using?)
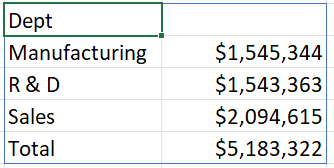
Given a table named tblRawData with a Dept column and a Salary column…

…you could write:
=GROUPBY(tblRawData[Dept],
(3 is a code that means, “show header”)

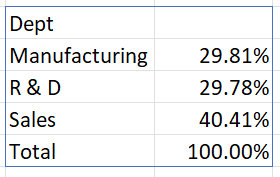
Or, you could write:
=GROUPBY(tblRawData[Dept],
(to calculate the Percent of total, show headers, total and sort by the first column)

In effect, this is a single formula that replaces either a PivotTable or two other dynamic array formulas:
- =SUMIFS(tblRawData[Salary],
tblRawData[Dept], SORT(UNIQUE(tblRawData[Dept]))) for the calculations and - =SORT(UNIQUE(tblRawData[Dept])) for the row headers
Here’s the official breakdown from Microsoft:
Microsoft Excel GROUPBY Syntax
GROUPBY(row_fields,
| row_fields | RequiredReq. | A column-oriented array or range containing the values which are used to group rows and generate row headers The array or range may contain multiple columns. If so, the output will have multiple row group levels. |
| values | RequiredReq. | A column-oriented array or range containing the data to aggregate The array or range may contain multiple columns. If so, the output will have multiple aggregations. |
| function | RequiredReq. | An explicit or eta reduced lambda (SUM, PERCENTOF, AVERAGE, COUNT, etc.) that is used to aggregate values A vector of lambdas can be provided. If so, the output will have multiple aggregations. The orientation of the vector will determine whether they are laid out row- or column-wise. |
| field_headers | A number that specifies whether the row_fields and values have headers and whether field headers should be returned in the results 0: No | |
| total_depth | Determines whether the row headers should contain totals. The possible values are: 0: No Totals | |
| sort_order | A number indicating how rows should be sorted | |
| filter_array | A column-oriented 1D array of Booleans that indicate whether the corresponding row of data should be considered |
The Next Level - HSTACK
If you need multiple aggregations, use HSTACK.
Example:
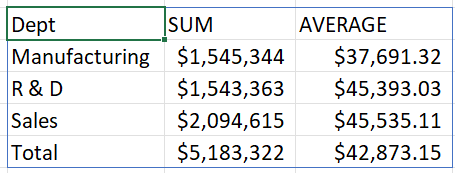
=GROUPBY(tblRawData[Dept],
(to calculate the SUM and AVERAGE, show headers, totals and sort by the first column)

Learn more about Excel when your register now for one of our most popular live, online courses:
One-Day Advanced Training for Microsoft® Excel®
Excel® Power Tools: Power Query and Power Pivot
Do you want to group by a secondary category (like Division)? Then you’ll love PIVOTBY.
Microsoft Excel PIVOTBY
PIVOTBY is an extended version of GROUPBY that provides a second (columnar) dimension. You can group by two criteria; one whose output is vertical (like GROUPBY) and the other horizontal.
For instance, if you had a table of salary data, you might generate a summary of sales by Dept and Division.

Previously, the calculations would have required three formulas!
- =SUMIFS(tblRawData[Salary],
tblRawData[Dept], SORT(UNIQUE(tblRawData[Dept])), tblRawData[Division], TRANSPOSE(SORT(UNIQUE( tblRawData[Division])))) for the calculations - =SORT(UNIQUE(tblRawData[Dept])) for the row headers, and
- =TRANSPOSE(SORT(UNIQUE(
tblRawData[Division]))) for the column headers
Now, all you’ll need to write is one formula:
PIVOTBY(tblRawData[Dept], tblRawData[Division], tblRawData[Salary],SUM)
(to calculate the SUM of Salary by Dept and By Division with Totals in the table named tblRawData)
PIVOTBY Syntax
The syntax of the PIVOTBY function is:
PIVOTBY(row_fields,
| row_fields | RequiredReq. | A column-oriented array or range containing the values which are used to group rows and generate row headers The array or range may contain multiple columns. If so, the output will have multiple row group levels. |
| col_fields | RequiredReq. | A column-oriented array or range containing the values which are used to group columns and generate column headers The array or range may contain multiple columns. If so, the output will have multiple column group levels. |
| values | RequiredReq. | A column-oriented array or range of data to aggregate The array or range may contain multiple columns. If so, the output will have multiple aggregations. |
| function | RequiredReq. | A lambda function or eta reduced lambda (SUM, AVERAGE, COUNT, etc.) that defines how to aggregate the values A vector of lambdas can be provided. If so, the output will have multiple aggregations. The orientation of the vector will determine whether they are laid out row- or column-wise. |
| field_headers | A number that specifies whether the row_fields, col_fields and values have headers and whether field headers should be returned in the results. The possible values are: 0: No, there are no headers | |
| row_total_depth | Determines whether the row headers should contain totals. The possible values are: 0: No Totals | |
| row_sort_order | A number indicating how rows should be sorted | |
| col_total_depth | Determines whether the row headers should contain totals. The possible values are: Missing: Automatic: Grand totals and, where possible, subtotals | |
| col_sort_order | A number indicating how columns should be sorted | |
| filter_array | A column-oriented 1D array of Booleans that indicates whether the corresponding row of data should be considered Note: The length of the array must match the length of those provided to row_fields and col_fields. |
ETA REDUCED LAMBDA
Both GROUPBY and PIVOTBY use the SUM and AVERAGE functions. They can also be used with lambda (user-defined) functions (GROUPBY and SUM are examples of “eta reduced lambda” or “eta lambda” functions.)
What’s an “Eta Lambda”?
Dynamic array calculations using basic aggregation functions often require syntax, such as:
LAMBDA(x, SUM(x)) or LAMBDA(y, AVERAGE(y))
In the example above, x and y are merely dummy variables; an “eta lambda” function simply replaces the need the variables with simply,
SUM or AVERAGE
Be aware these my “look” like worksheet functions, but they are known as “eta lambdas.”
The list of “eta lambdas” eligible for GROUPBY and PIVOTBY functions include:
| ARRAYTOTEXT* | AVERAGE | CONCAT* | COUNT |
| COUNTA | MAX | MEDIAN* | MIN |
| MODE.SNGL* | PERCENTOF* | PRODUCT | STDEV.P |
| STDEV.S | SUM | VAP.P | VAR.S |
| ARRAYTOTEXT* | AVERAGE |
| CONCAT* | COUNT |
| COUNTA | MAX |
| MEDIAN* | MIN |
| MODE.SNGL* | PERCENTOF* |
| PRODUCT | STDEV.P |
| STDEV.S | SUM |
| VAP.P | VAR.S |
*Not available in a PivotTable
With GROUPBY and PIVOTBY added to your arsenal of Excel skills, you’ll be on the path to unlimited possibilities.
Microsoft reminds us: These functions are being developed and rolled out to users gradually. Their syntax and results may change before final release based on user feedback. Until final, Microsoft does not recommend using them in important workbooks.
Philip Wiest
Guest Blogger
Philip Wiest is an expert software trainer, computer analyst and database consultant who knows both the intricacies of computer systems and the ways today’s professionals need to use these essential business tools. Using his experience in Microsoft Excel and Microsoft Office, as well as Windows and the Internet, Phil uses a special mix of tactful guidance and distilled observation so his audiences learn and retain the critical keystrokes, application combinations and creative processes that save time and simplify computer use.
Latest Articles
Article Topics
